How to debug a KSP Gradle plugin
When writing a Kotlin Symbol Processor (KSP) plugin for Gradle, it is invaluable to be able to debug your code. In this short article I will show how to set this up properly using Gradle 7.6 and Kotlin 1.8.0, with remote debugging through IntelliJ 2022.3.1, but these instructions should also work for newer versions.
To debug our KSP code, we need to achieve the following:
- The Gradle task that invokes our KSP processor should be executed
- Gradle should start and then suspend, waiting for a debugger to attach
- The KSP execution should happen in the same JVM process that is being debugged
TL;DR: Run Gradle like this (assuming the project is called example):
./gradlew :example:kspKotlin --rerun -Dorg.gradle.debug=true --no-daemon \
    -Pkotlin.compiler.execution.strategy=in-process
then attach a remote JVM debugger at port 5005.
Always executing our KSP task Link to heading
Gradle tries to execute as few tasks as possible, marking them as UP-TO-DATE and skipping them whenever it can. This can cause Gradle to skip our KSP if it thinks nothing’s changed. For debugging it is better to always execute this task. Therefore, we will specify the KSP task kspKotlin explicitly and use Gradle 7’s
--rerun option to ensure that specific task is always run, but the other tasks retain their incremental behavior. At this point we have the following command line:
./gradlew :example:kspKotlin --rerun
Alternatively, you can specify any other task (e.g., build) and use the --rerun-tasks option to just rerun all tasks. For example, ./gradlew build --rerun-tasks. However, this is slower than --rerun on a specific task.
Starting Gradle in debugging mode Link to heading
In general, to debug a Gradle build, we need to start Gradle with the -Dorg.gradle.debug=true flag, meaning that Gradle will suspend and listen for a debugger to attach to port 5005.
This is equivalent to setting the following on the Gradle process:
-agentlib:jdwp=transport=dt_socket,server=y,suspend=y,address=5005
However, after attaching the debugger once, the Gradle daemon will stay alive and will no longer suspend on subsequent builds. Therefore, we also need to specify --no-daemon to ensure a new Gradle process is created every time we start the build.
The command-line now looks like this:
./gradlew :example:kspKotlin --rerun -Dorg.gradle.debug=true --no-daemon
Ensuring KSP is executed in the same process Link to heading
By default Kotlin will execute the KSP in a separate Kotlin daemon process, but then we cannot debug our code or trigger breakpoints. To ensure KSP is run in the same process, we need to specify kotlin.compiler.execution.strategy with the value in-process. In previous versions of Kotlin this was a system property (to be specified with the -D option), but since Kotlin 1.7 this is a Gradle property (to be specified with the -P option or in the gradle.properties file), and since Kotlin 1.8 the system property has been removed and has no effect.
As such, we need to specify -Pkotlin.compiler.execution.strategy=in-process and obtain our final command-line:
./gradlew :example:kspKotlin --rerun -Dorg.gradle.debug=true --no-daemon \
    -Pkotlin.compiler.execution.strategy=in-process
Attaching to the Gradle process from IntelliJ Link to heading
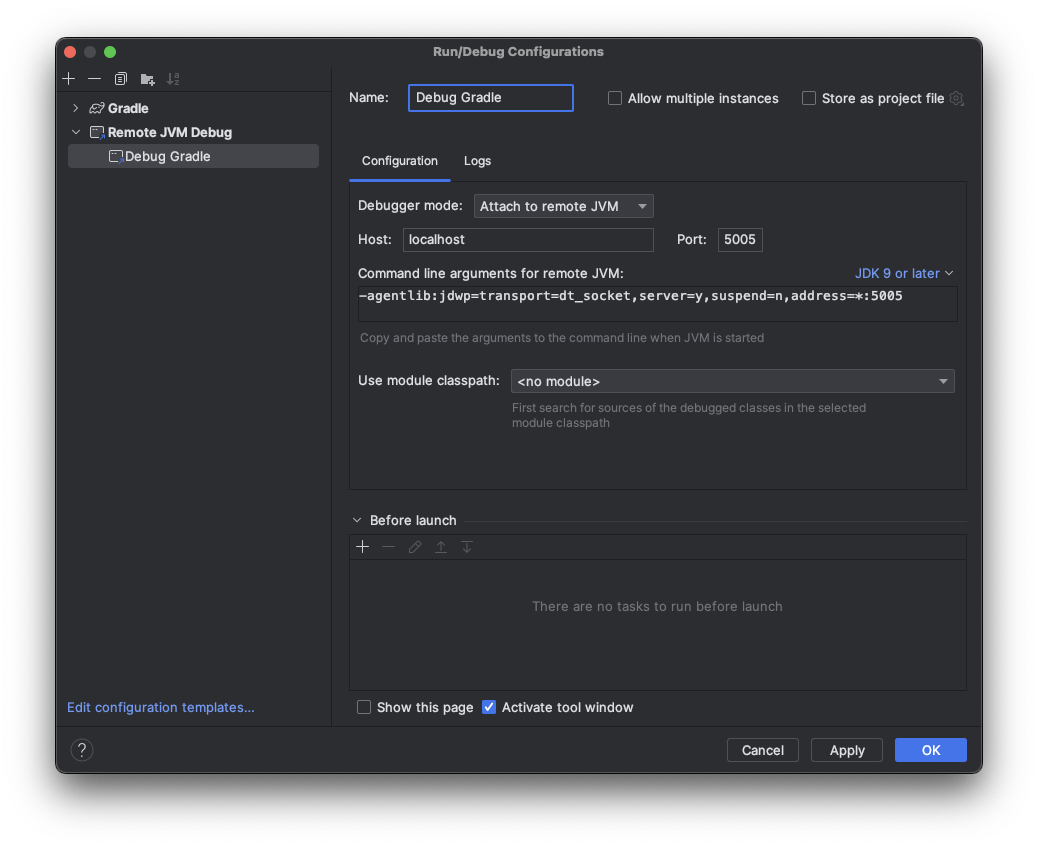
When you execute the above Gradle command, it stops and waits for the debugger, showing only > Starting Daemon. At this point we should attach the debugger. In IntelliJ, go to the Run Configurations and create a new Remote JVM Debug run configuration. The default settings connect it to local port 5005, which is correct for our case.
Then, when you Debug this run configuration, it attaches to the Gradle process. Gradle continues execution, and your breakpoints should be hit.
Troubleshooting Link to heading
Breakpoints are not hit Link to heading
If Gradle waits for the debugger and continues once you’ve attached it, but your breakpoints are not being hit, ensure that:
- your have refreshed your Gradle project in IntelliJ
- the Kotlin compiler is executed in the same process (
-Pkotlin.compiler.execution.strategy=in-process) - the KSP task is actually being executed and not just
UP-TO-DATE(--rerunor--rerun-tasks)
Gradle does not wait for the debugger Link to heading
If Gradle does not wait for the debugger, ensure that:
- you are starting a new instance every time (
--no-daemon) - you have enabled debugging (
-Dorg.gradle.debug=true)
Transport error 202: bind failed: Address already in use Link to heading
Gradle cannot listen for a debugger if another process is already occupying this port. Most likely it’s a previous Gradle daemon that has not died yet. Stop the Gradle daemons using:
./gradlew --stop
Or find out which process is using this port through:
lsof -i :5005
Unable to open debugger port (localhost:5005) Link to heading
If IntelliJ complains that it cannot open the debugger port, then another process is already occupying this port. Try the same steps as above with IntelliJ.
Start Gradle project from IntelliJ Link to heading
It seems that IntelliJ doesn’t understand --no-daemon and doesn’t honor -Dorg.gradle.daemon=false and always runs the project in a daemon. This means that once you start your Gradle project in debugging mode, the daemon will occupy the port and you’ll have various issues. So far the only consistent way I’ve found is to start the project from the command-line using the above command.